Math Made Easy: What Is the End Behavior of a Function, and How to Spot It?
A graph's ending is already hiding in its formula. Learn to spot it, and polynomial, rational, and exponential functions all start making sense at a glance.
Last updated: Jul 14, 2026
Read time: 8 min

By Yegor Shevtsov
Economist, Ph.D. in World Economy
Some math graphs seem to go on forever, while others take a nosedive off the page and never look back. The end behavior of a function explains why graphs look the way they do. And once you get it, reading any chart feels less like guesswork and more like having a cheat code.
This time, you'll learn how to predict where any function is headed, breaking down the math, the logic, and a few real-world reasons to care into short, clear sections.
The Nibble app is built exactly for moments like this. It turns boring school subjects like math into quick, engaging lessons that fit your morning coffee or afternoon snack break. No burnout, no boredom.
Try Nibble today and build your math skills one bite at a time.
Quick tips for reading math graphs
Here's what to keep in mind every time you face a new graph.
- Check the largest exponent to determine the main shape instantly.
- Find the leading coefficient to track the general graph direction.
- Watch what happens as x approaches infinity to map the outer edges.
- Notice rational functions creating flat, horizontal lines.
What happens at the edges of a graph?
Graphs stretch far to the left and right across the page. The behavior of the function at these far edges is a key concept in math. It tells us where the line goes when numbers get huge, and you can predict it without doing endless arithmetic.
What is end behavior in math?
It tells you whether the line shoots upward or drops into negative territory. Once you get this idea, reading the graph of a function becomes far less mysterious. You'll never feel lost looking at a chart again.
When X approaches very large positive numbers, the line might climb toward positive infinity. It might also drop fast toward negative infinity. It all depends on the math formula in front of you. Every equation has its own story.
The concept of a math function shows that understanding how inputs produce outputs is foundational to reading any graph with confidence. You plug in a number, follow the rule, and watch where it goes.
💡 One concept at a time, one minute at a time. That's how the Nibble app turns tricky math into something you remember. Start today.
How to spot the end behavior of the function: A step-by-step guide
Forget plotting dozens of points. You can predict exactly where a graph is heading by looking at just a few key details.
Many students ask how does end behavior work or how to find end behavior of a function without graphing dozens of points. The good news is that most functions reveal their end behavior through just a few clues, including the degree, leading term, and leading coefficient.
Step 1. Look closely at the degree of the polynomial
If you're wondering how to determine end behavior of a polynomial, the degree is always the first thing to check. It tells you whether the graph's ends move in the same direction or opposite directions.
Every polynomial function has a specific degree. The degree of the polynomial is simply the largest exponent in the formula. Think of it as the steering wheel for the entire graph. It controls what happens at the edges.
An odd degree means the ends go in opposite directions. One side goes up, the other goes down. A classic example is a diagonal line that crosses the center and keeps going.
An even degree means that both ends point in the same direction, either both up or both down. A parabola is a perfect example of an even-degree shape. The end behavior of a parabola depends on whether the leading coefficient is positive or negative.
A positive coefficient makes both ends rise, while a negative coefficient makes both ends fall. It forms a smooth, symmetrical curve.
These simple rules apply directly to the end behavior of a polynomial. You can sketch the general shape just by glancing at that top number. It saves a lot of time during exams. You skip the tedious calculation and jump straight to the answer.
Step 2. Find the highest power and leading term
Learning how to tell end behavior of a polynomial becomes much easier once you identify the leading term. At large values of x, this term dominates the entire equation.
The leading term is the part of the equation with the highest power. This single piece drives almost everything about the far edges of the graph. Smaller terms fade into the background as numbers get enormous.
When x gets massive, that highest power takes over. This makes your math job simple: focus on the one term that matters most.
You only need to calculate that one main piece to analyze the following function with confidence. You'll spot the types of end behavior quickly, and the whole thing takes seconds once you've practiced a bit. It's one of those math tricks that always pays off.
💡 You just decoded how graphs behave at their edges. Imagine what else you could pick up in 10 minutes a day on the Nibble app.
Step 3. Check the positive leading coefficient
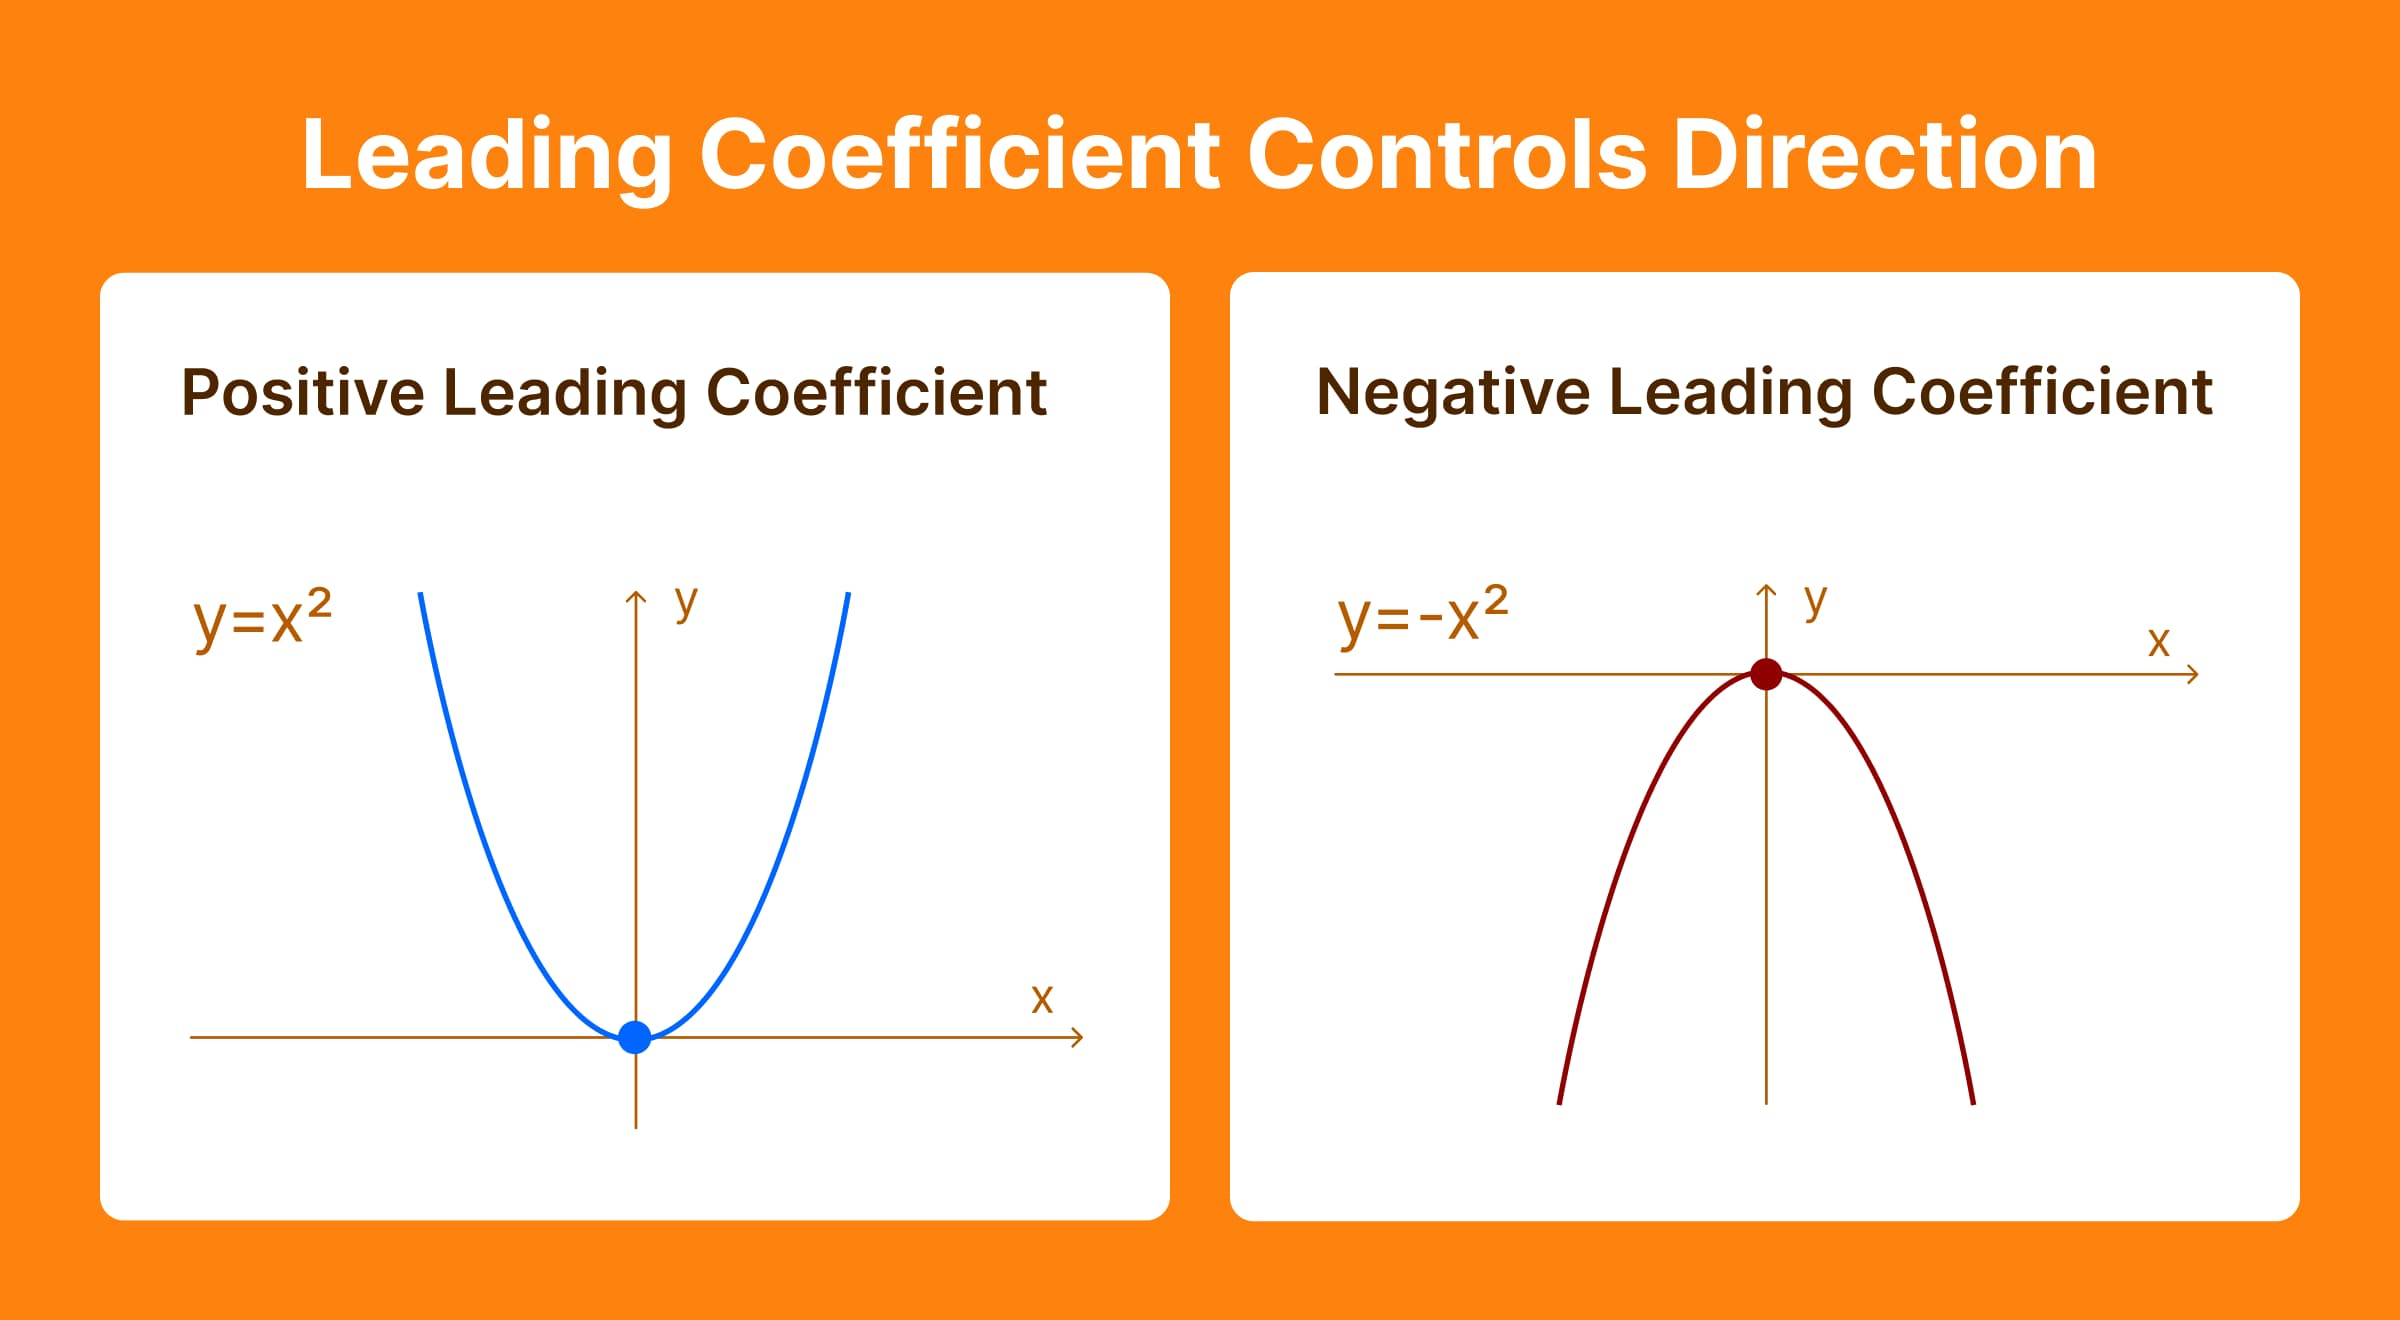
The number attached to your highest power is the leading coefficient. A positive leading coefficient pushes the right side of your graph upward, aiming for the top of the page.
If the degree is even, the left side goes up too. Both arms reach skyward, like a smile drawn on the page.
If the degree is odd, the left side drops down while the right side climbs. The line crosses the x-axis and continues to rise. It's a steady, predictable pattern you can sketch in moments.
Once you see a positive number in front, you know the graph's direction. The outer edges give you all you need.
Step 4. Notice the negative leading coefficient instantly
A negative leading coefficient flips the entire script. The right side of the graph drops toward the floor as numbers grow.
For an even degree, both sides drop downward. It's the mirror image of the smile, pointing toward the bottom of the page and heading toward negative infinity.
For an odd degree, the left side points up as the right side falls. The line descends as you read left to right.
Seeing a negative sign at the front of an equation is a giant clue. It immediately shows that values are shrinking at the edges. No need to punch fifty numbers into a graphing calculator. You just look at the front of the equation, and you already know.
Step 5. Analyze rational functions and asymptotes
Rational functions feature a numerator sitting over a denominator, like a fraction. If you want a quick refresher on working with fractions first, this guide on how to divide fractions is a good starting point before diving into rational functions.
These graphs behave slightly differently at the edges. Sometimes they flatten out into a straight horizontal line called an asymptote.
Here's the interesting part: As x heads toward the extremes, the graph creeps closer and closer to that flat line. It might actually cross the asymptote somewhere in the middle of the graph, but at the edges it settles near that value and stays there. This rule applies only to horizontal asymptotes, not to vertical ones.
Think of the asymptote as describing where the graph ends up, not a wall it can never touch.
Compare the exponents in the top and bottom terms to find the horizontal asymptote. The line flattens out near zero if the denominator's exponent is larger. If the exponents match, divide the leading coefficients. It's a clean, logical puzzle with a clear answer every time.
💡 The best part about understanding one math concept? It makes the next one easier. Keep that momentum going on the Nibble app.
How exponential functions operate in daily life
Exponential functions grow fast. The graph shoots upward almost instantly on one side. As x moves left toward negative infinity, the line flattens out close to zero, getting impossibly close without ever quite arriving.
These types of functions model the early stages of things that build on themselves, like the beginning of a viral outbreak or compound interest quietly snowballing in a savings account. They don't zigzag across the page. They climb hard in one direction and taper gently in the other.
When reporters talk about exponential growth, now you know exactly what the graph looks like. Things are moving fast, and the curve proves it.
Why do trigonometric functions always oscillate?
Trigonometric functions don't follow the standard edge rules, and honestly, that's what makes them interesting. They move in repeating, endless waves, moving up and down continuously, never settling on a single value at the edges.
They'll never reach a final infinity point because they oscillate forever. They just keep rolling. Sound waves, ocean tides, the swing of a pendulum: all of these follow the same wavy pattern mapped out by trig functions. Nature loves a repeating cycle, and these functions capture that perfectly.
There's no standard edge pattern to memorize here. If you enjoy this kind of geometric thinking, the article on what a regular polygon is explores how shapes and symmetry connect to the same branch of math. Trigonometric functions play by their own rules, which is exactly why they don't fit the usual types of end behavior.
💡 10 minutes. One concept. A brain that feels genuinely sharper. That's the Nibble app in a nutshell.

Ditch the scroll for math-flavored fun with the Nibble app
The end behavior of a function is one of those ideas that changes how you read charts and data for good. Understand a few simple rules about degree and leading coefficient, and suddenly graphs tell you a story instead of giving you a headache.
Complex math becomes accessible when it's broken into the right pieces.
The Nibble app takes exactly this approach across every subject it covers. It replaces mindless scrolling with quick, engaging lessons that become part of your actual day.
With 400+ pieces of knowledge across 20+ topics, there's always something worth learning in the ten minutes you have between meetings or before bed. You build broader knowledge and have smarter conversations without the struggle.
Don't let a busy schedule put a ceiling on your curiosity.
Download Nibble today and take your brain somewhere interesting. Join 4,000,000+ users learning something new every single day.
FAQs
How do you find the end behavior of a polynomial function?
To find the end behavior of a polynomial function, look at its degree and leading coefficient. The degree tells you whether the graph's ends move together or in opposite directions, while the leading coefficient determines whether those ends point upward or downward.
What defines the end behavior of a function?
It describes how a graph behaves as input values become extremely large or extremely small. The line will either climb, drop, or flatten out near a specific value. It gives you the overall trend of the equation without plotting a thousand individual points.
How does the leading term test work?
You look at the piece of the equation with the highest exponent. That single term drives the entire direction of the graph as numbers grow. The smaller terms in the equation fade away, leaving the leading term to determine the final shape.
Why do some graphs have a flat asymptote?
Rational functions, which have a numerator and a denominator, often flatten out at the edges. As x grows large, the fraction approaches a specific limit. The graph hovers close to that flat line way out at the extremes.
Does every function have an end behavior?
Most do. But some, like trigonometric functions, move in repeating waves that never settle. They don't head toward infinity or zero. They keep bouncing back and forth, which is why they don't follow the usual edge rules.
How does end behavior work?
End behavior describes what happens to a graph as x becomes very large or very small. Instead of focusing on points in the middle, you examine where the graph heads at its far left and far right edges.
How do you find the end behavior of a function?
To find the end behavior of a function, identify the function type first. For polynomials, use the degree and leading coefficient. For rational functions, check for horizontal asymptotes. For exponential functions, look at whether the graph grows or approaches zero.
Published: Jul 14, 2026
4.7
+80k reviews
We help people grow!
Replace scrolling with Nibbles - 10-min lessons, games, videos & more
